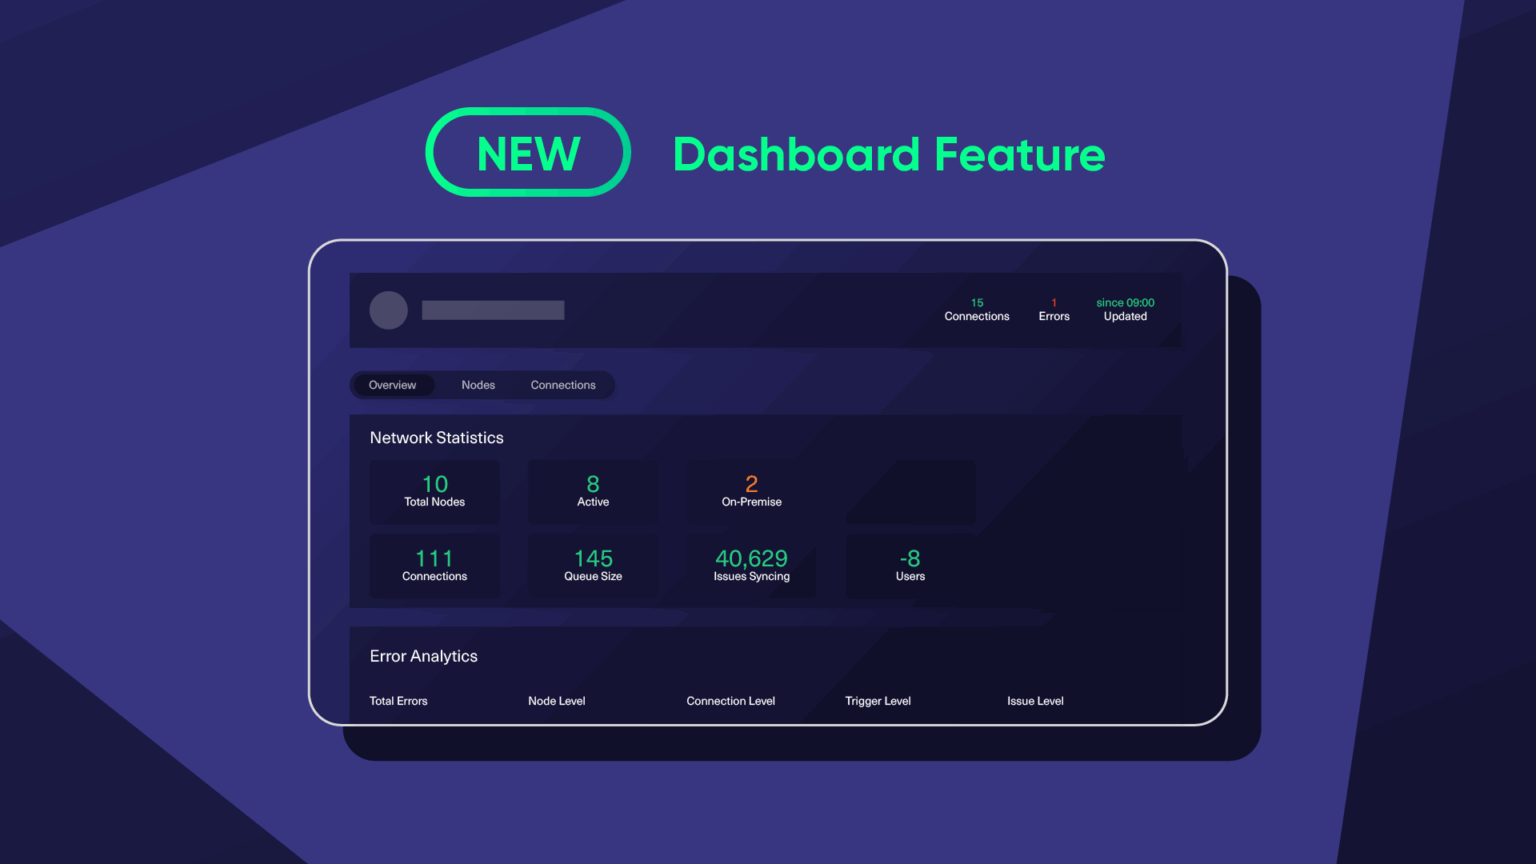
Exalate has just launched a dashboard feature, designed to make tracking and managing integration performance more intuitive than ever.
The dashboard consolidates sync statuses, connection health, and analytics into a unified view, making it easier for both technical and business teams to understand how their distributed workflows are performing.

Exalate CEO, Francis Martens, promises that the dashboard will “offer organizations a new level of clarity” by surfacing real-time insights from multiple platforms, teams, and geographies.
This launch reflects Exalate’s broader mission: empowering organizations to maintain full control, transparency, and flexibility over their integrations, no matter how complex or distributed their environments become.

The Exalate Dashboard addresses this gap by bringing together operational metrics and actionable analytics in one place. We aim to give teams a tool that turns complexity into clarity.
All Exalate users can access the dedicated monitoring dashboard for their individual nodes directly from the Exalate admin panel.