
TL;DR:
Visionade, the newest app by Exalate, brings clear, interactive data visualization directly into Jira — no exports, no extra tools.
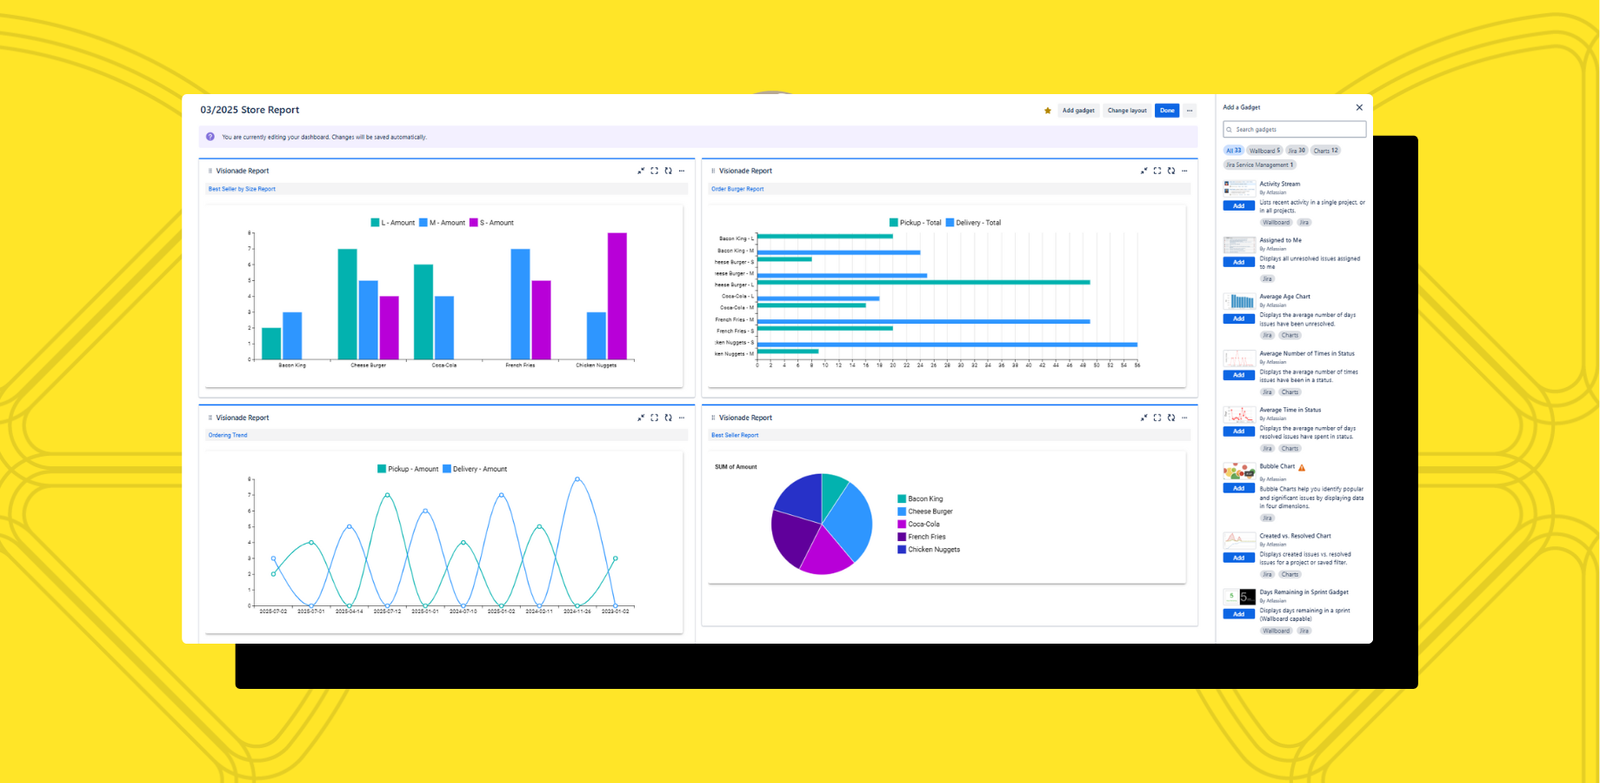
Create drag-and-drop dashboards, visualize trends with dynamic charts, and keep everything up to date in real time.
👉 Now live on the Atlassian Marketplace
Most businesses sit on a mountain of data—yet struggle to turn it into real insights. Reports take forever. Spreadsheets pile up. And dashboards don’t always tell the full story.
That’s why we built Visionade—an app that brings clear, customizable data visualization directly into Jira.
No extra tools, no scattered spreadsheets—just dynamic reports where you need them.
Why Visionade
Jira users waste hours digging through data, clicking through filters, and trying to piece together the big picture. We saw the gap—and we filled it. Visionade eliminates the need for additional external analytics tools and makes reporting intuitive by bringing the data you need from external sources. It’s all inside Jira, seamlessly integrated with native Jira Dashboards.
With Visionade, you can:
- Custom Reports & Dashboards – Organize, filter, and present your data in a way that makes sense.
- Seamless Jira Integration – Work with your Jira data directly, no extra exports needed.
- Dynamic Charts & Graphs – Choose from multiple visualization options for clearer insights.
- Works Across Tools – Pull in data from Table Grid and other sources for a complete view.
It’s reporting made simple — powerful enough for data pros, intuitive enough for anyone.
See It in Action
Visionade is built to simplify reporting while keeping it flexible and fast. Try it out, explore the dashboards, and see your Jira data in a whole new light.
👉 Get Visionade on the Atlassian Marketplace!
Share Your Thoughts
If you give Visionade a try, we’d love your thoughts.
⭐️ Leave a quick review on the Marketplace — your input helps shape what comes next and makes Visionade even better for Jira teams everywhere.